Lab turnaround measured for each provider Transport and processing turnaround as median and P90
Each scan and each result dates a step. ClinicareOS turns them into transport time, from dispatch to the sample's arrival, and processing time, from arrival to result, provider by provider.
- Transport
- From dispatch (T0) to sample arrival (T1)
- Processing
- From arrival (T1) to result (T2)
- Measure
- Median, P90 and number of measurements, in calendar time
- Little data
- Flagged under 10 measurements
- Assignment
- Usual lab, lab of the period, or manual choice with a reason
- Cancellations
- Counted apart, never in the turnaround
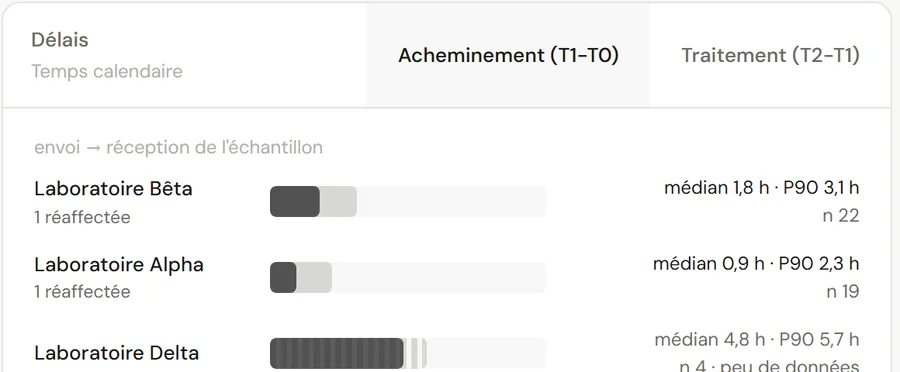
Transport times of a made-up clinic: median, P90 and number of measurements.
Three times and two turnarounds Set by scans and not by typing
T0 at dispatch
The request goes to the provider.
T1 at receipt
The lab scans the order when the sample arrives.
T2 at the result
The result is uploaded in the portal.
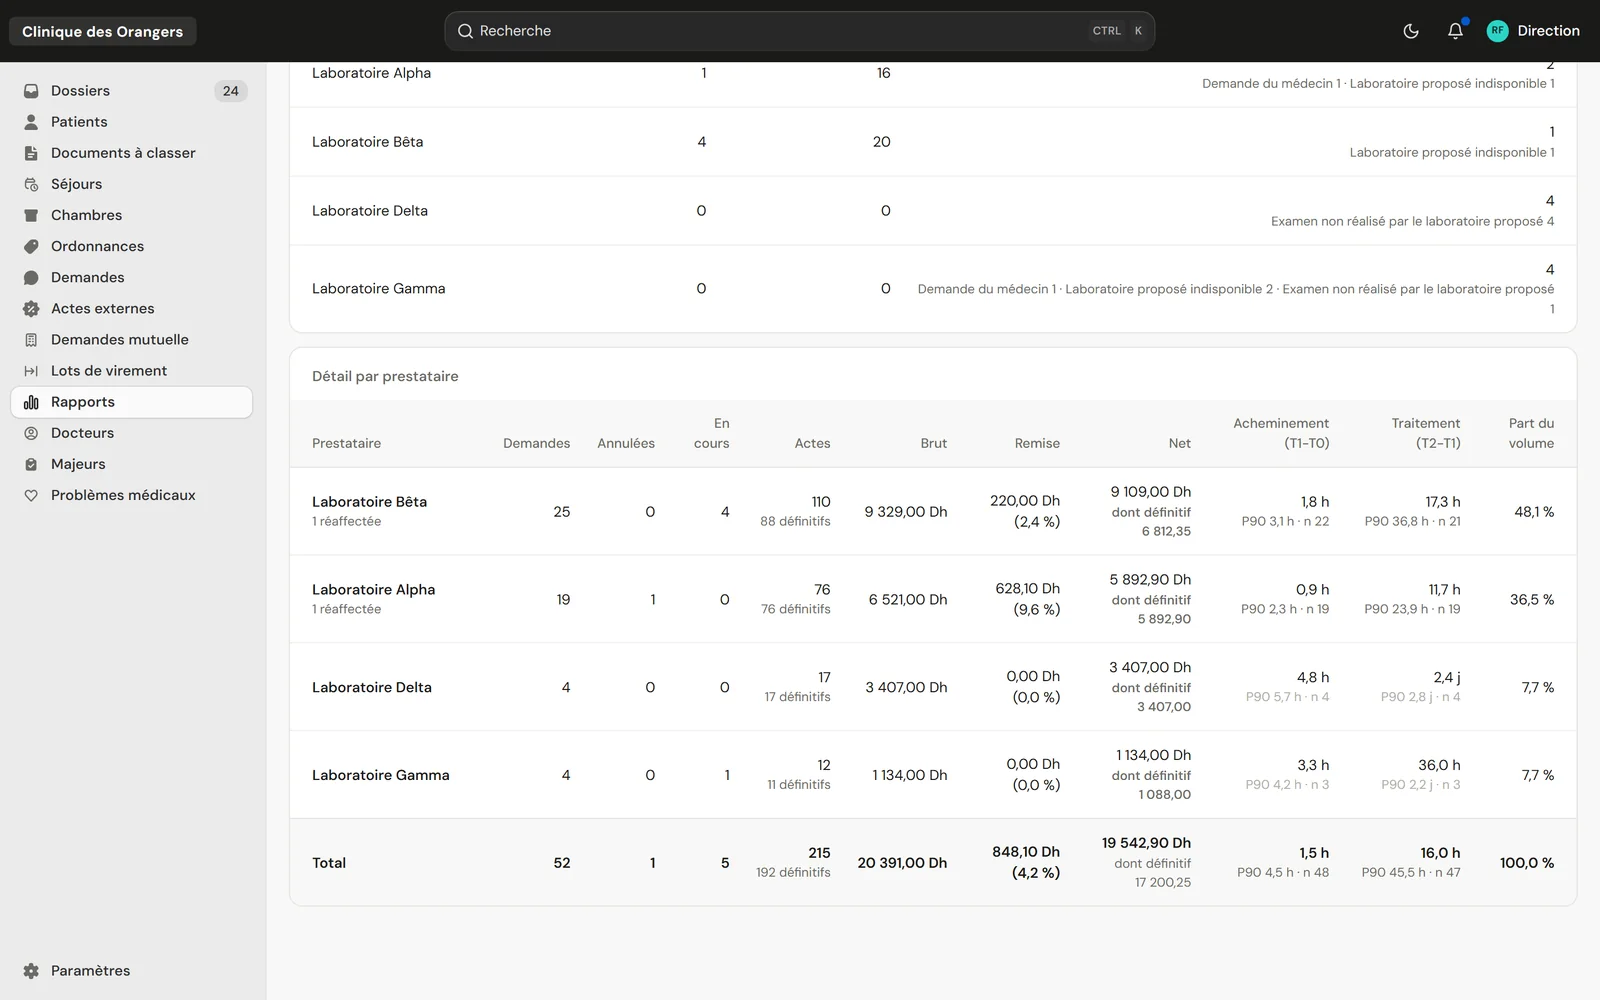
How to read turnaround Figures you can defend in front of a provider
| Figure | What it says |
|---|---|
| Median | Half of the tests arrive faster. |
| P90 | Nine tests out of ten arrive faster: the time to count on. |
| n | The number of measurements behind the figure. |
| Little data | Fewer than 10 measurements: the bar is hatched. |
| Reassigned | The time counts from the new assignment. |
About efficiency
Why not an average?
One very late test skews an average. The median and P90 give the usual time and the one to count on.
Can we compare two labs?
Yes, over the same period and test type, never mixing types.