
Key figures
Requests, acts, net amount, in progress, and median turnaround, with the gap to the previous month.
Who it's for
Private clinicsFront desk, care and billing on one fileClinic groupsEach facility, or all of them togetherLabs and imagingA portal to receive and return testsThe labs' portal
Your labs and imaging centres receive orders, scan samples and upload results in the same system.
See the portalThree reports: providers, acts of the ANAM catalogue, patients and stays. Each figure compares to the previous period, filters by provider type and exports.
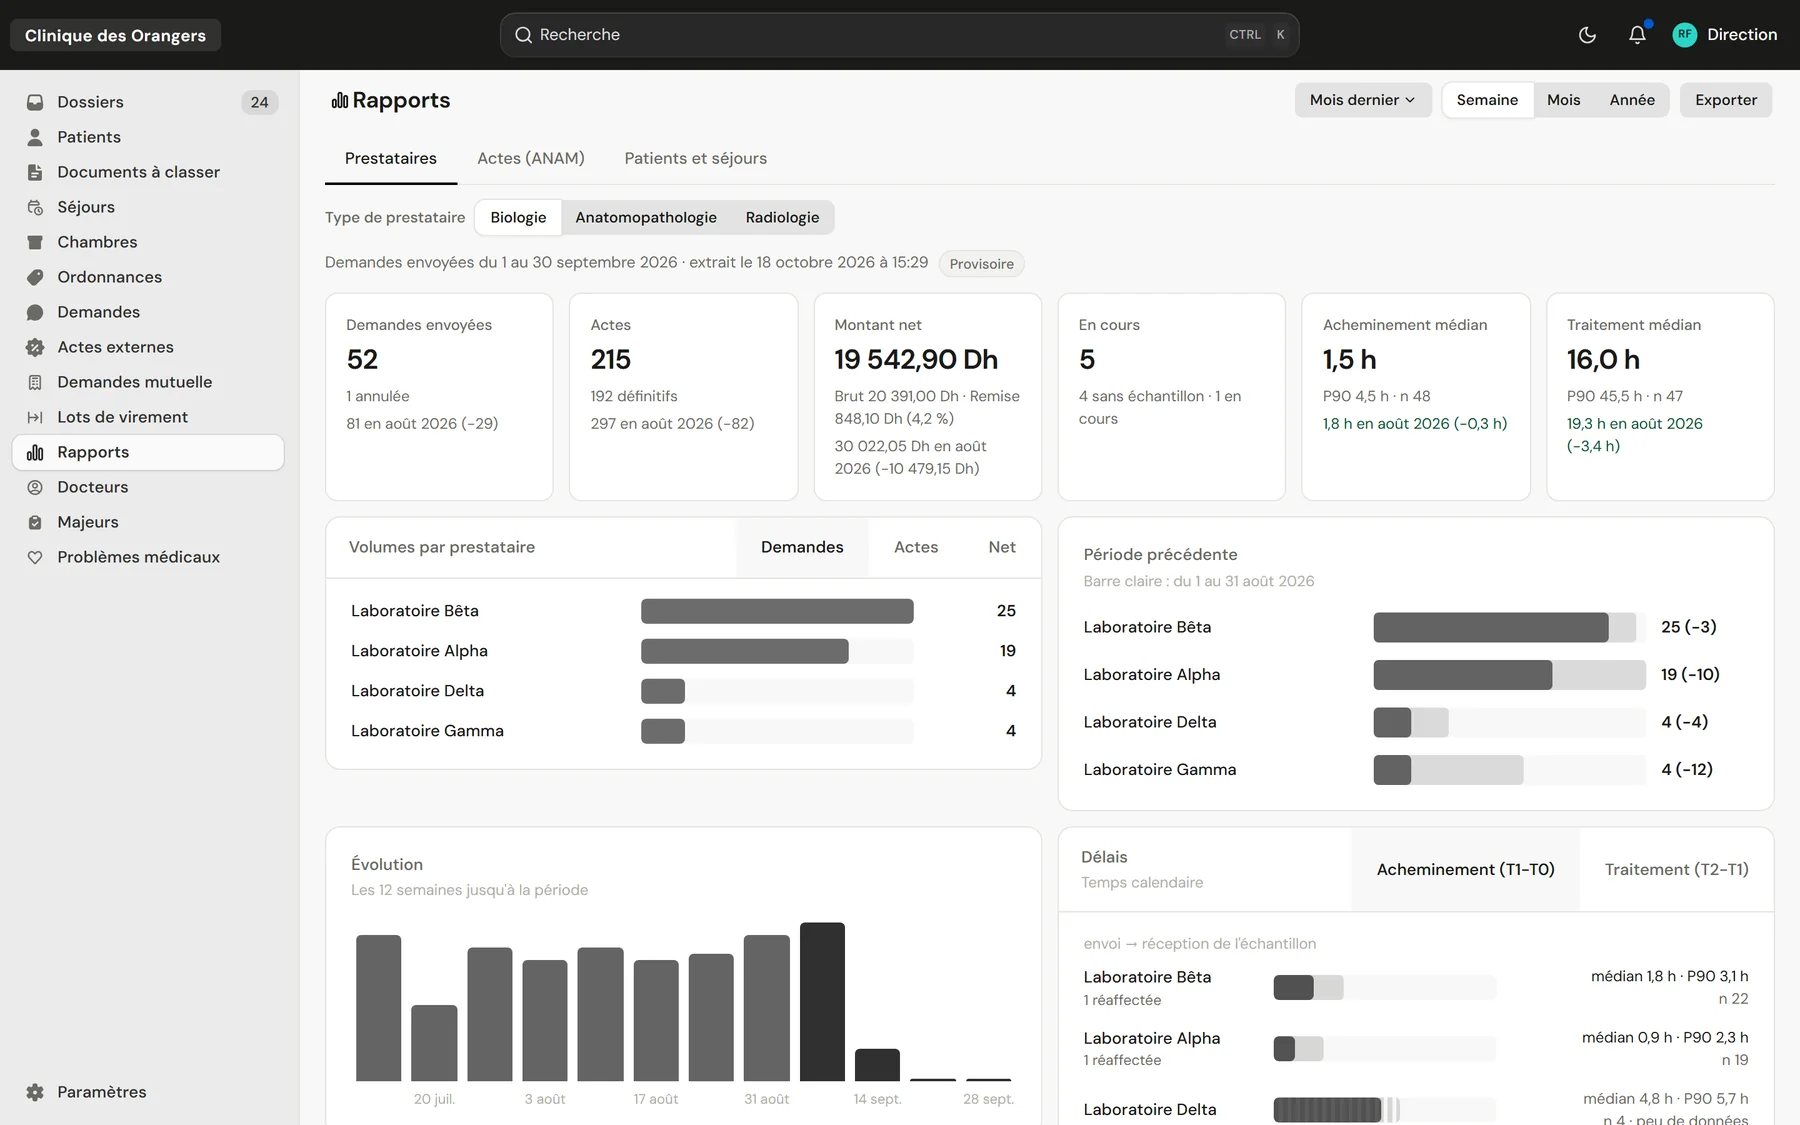
The “Providers” report of a made-up clinic, for September.
Requests, acts, net amount, in progress, and median turnaround, with the gap to the previous month.
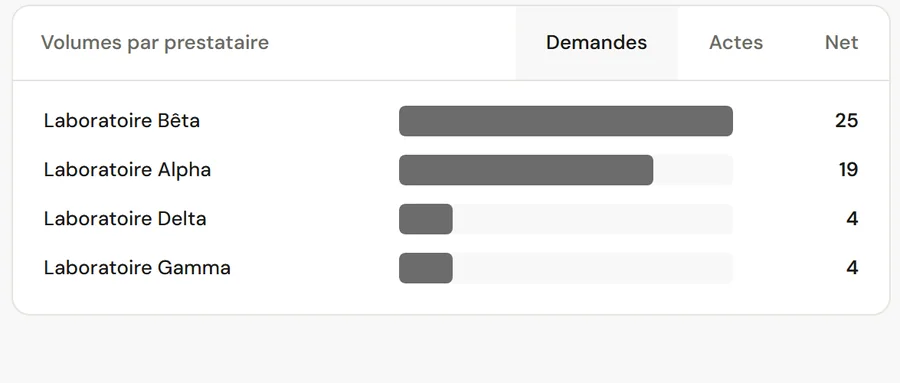
In requests, acts or net amount.
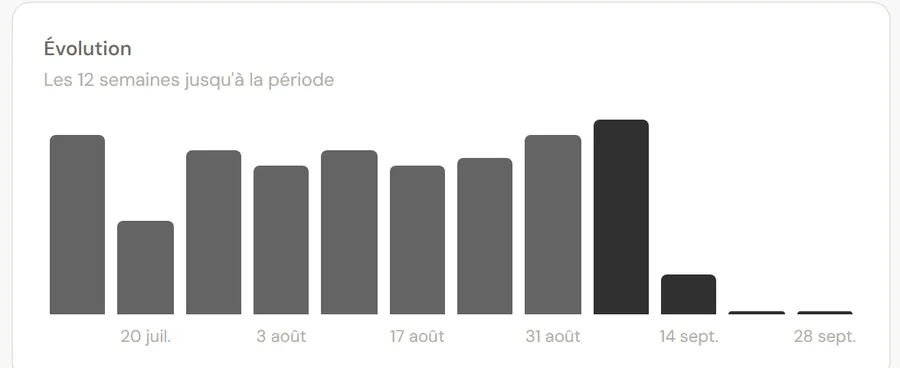
The last twelve periods, to see the season and the trend.
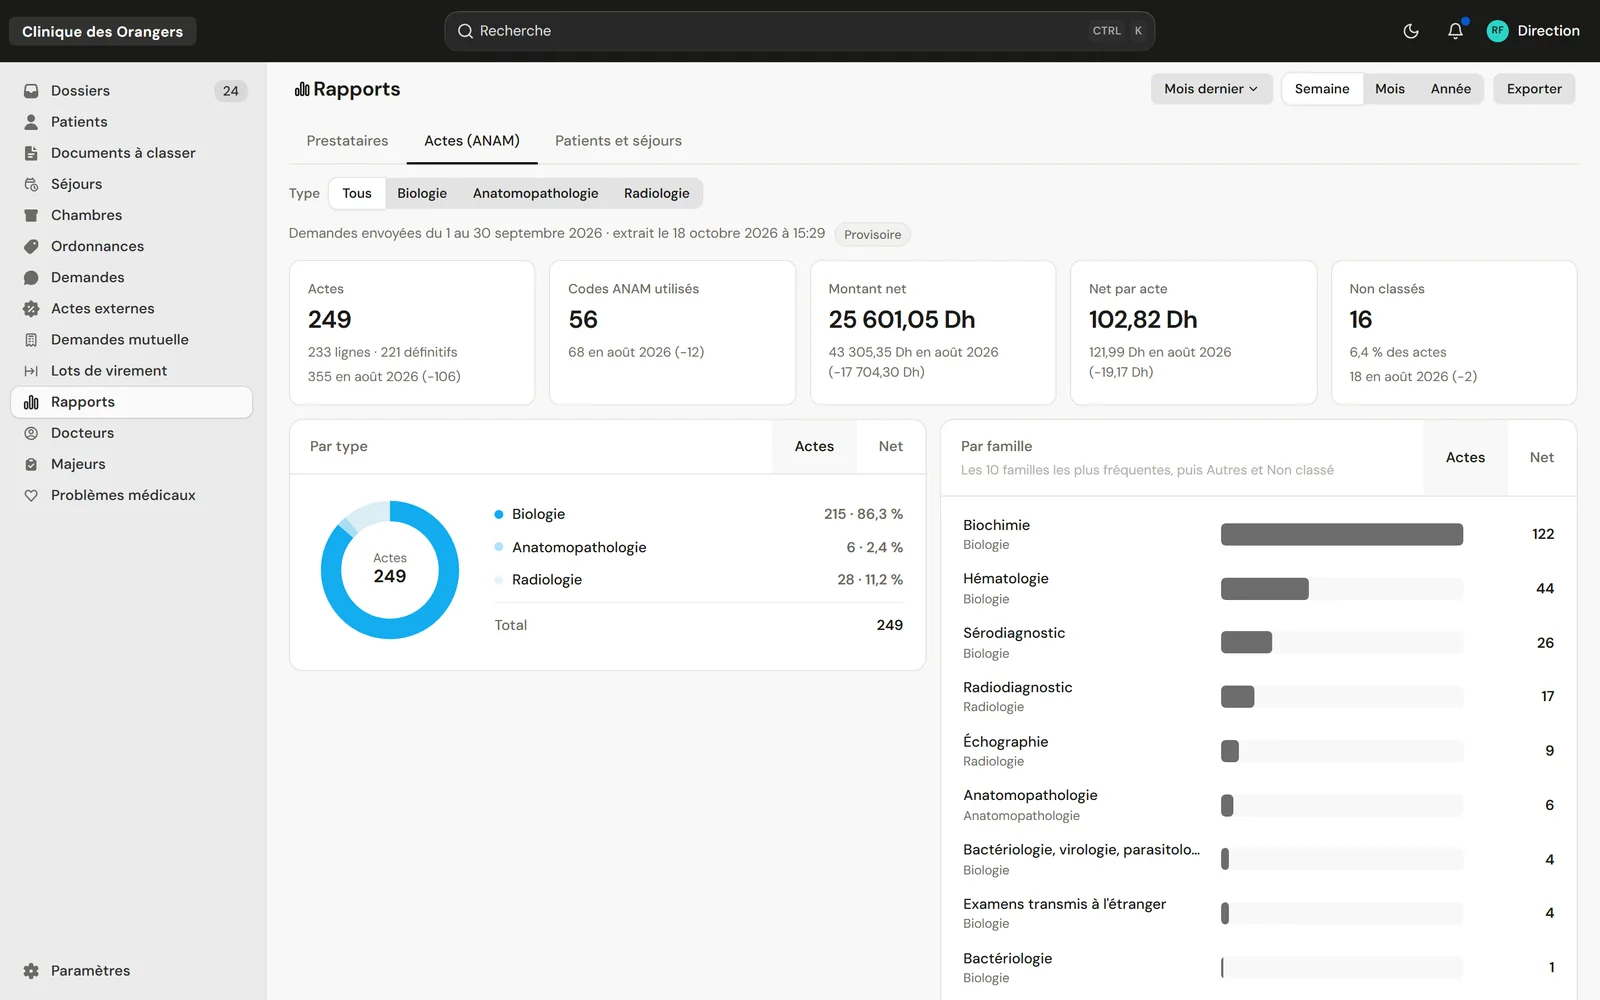
Acts by type and catalogue family, with the codes used and the net per act.
| Report | What it shows |
|---|---|
| Providers | Requests, acts, amounts and turnaround, provider by provider. |
| ANAM acts | Acts by type and catalogue family, the codes used, the net per act. |
| Patients and stays | Patients admitted and stays of the period. |
No. Reports live inside ClinicareOS, and no third-party tool reads the database.
Yes, facility by facility or together, depending on each person's access.